10 Executive Dashboard Metrics Every PMO Should Track
The essential KPIs that every PMO needs to monitor for effective portfolio governance. Learn what to measure and why it matters.
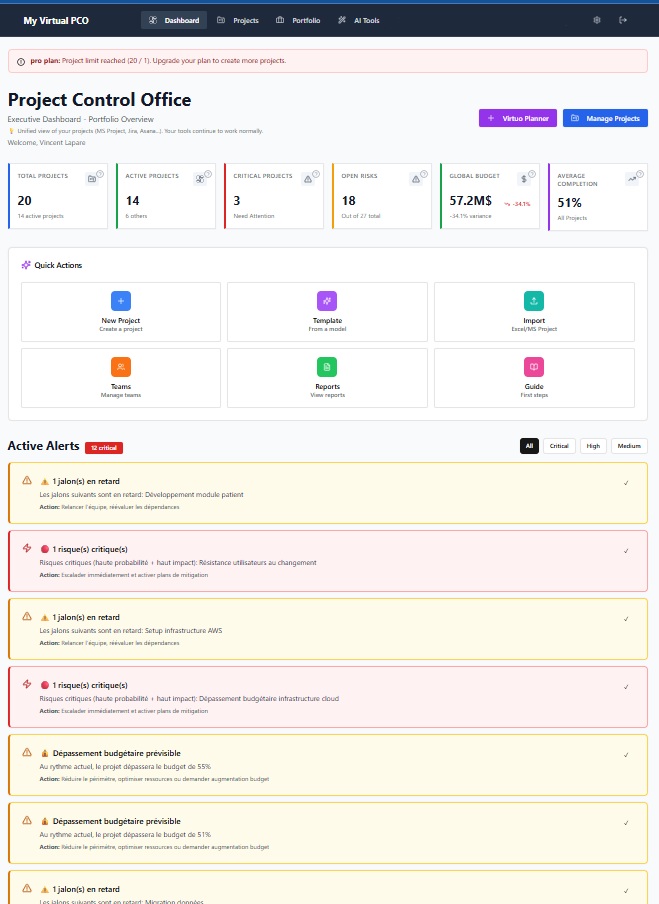
10 Executive Dashboard Metrics Every PMO Should Track
Executive dashboards should answer one question: "Is my portfolio healthy?" Here are the 10 metrics every PMO needs to track for effective governance.
1. Portfolio Health Score
What it measures: Overall project portfolio status
Calculation: Weighted average of:
- Schedule variance (30%)
- Budget variance (30%)
- Risk status (20%)
- Resource utilization (10%)
- Stakeholder satisfaction (10%)
Why it matters: Provides instant snapshot of portfolio health. Should be visible on first screen of dashboard.
Target: >80% green, <10% red
Action triggers:
- <70%: Executive intervention required
- 70-80%: Detailed review needed
-
80%: Continue monitoring
2. Schedule Performance Index (SPI)
What it measures: Efficiency of time utilization
Calculation: Earned Value / Planned Value
Why it matters: Indicates if projects are ahead or behind schedule. More reliable than simple milestone tracking.
Interpretation:
- SPI > 1.0: Ahead of schedule
- SPI = 1.0: On schedule
- SPI < 1.0: Behind schedule
Target: SPI ≥ 0.95
Red flags:
- Declining trend over 3+ periods
- SPI < 0.85 for critical projects
- Wide variation across portfolio
3. Cost Performance Index (CPI)
What it measures: Budget efficiency
Calculation: Earned Value / Actual Cost
Why it matters: Shows if you're getting value for money spent. Historical CPI predicts final costs.
Interpretation:
- CPI > 1.0: Under budget
- CPI = 1.0: On budget
- CPI < 1.0: Over budget
Target: CPI ≥ 0.95
Warning signs:
- CPI < 0.90 early in project
- Declining CPI trend
- CPI divergence from SPI
4. Active Risk Count by Severity
What it measures: Number and severity of open risks
Breakdown:
- Critical: Immediate threat to project success
- High: Significant impact if realized
- Medium: Moderate impact
- Low: Minor impact
Why it matters: Early indicator of potential problems. Risk count should decrease over project lifecycle.
Target:
- <3 critical risks per project
- Trend: declining over time
- 80%+ have mitigation plans
Action triggers:
- New critical risk: Immediate escalation
- Increasing risk count: Review needed
- Risks without owners: Assignment required
5. Resource Utilization Rate
What it measures: How efficiently resources are used
Calculation: (Allocated Hours / Available Hours) × 100
Why it matters: Identifies over-allocation (burnout) and under-allocation (inefficiency).
Target: 75-85% utilization
Interpretation:
- <70%: Underutilized resources
- 70-85%: Optimal range
- 85-95%: High utilization, monitor closely
-
95%: Over-allocated, burnout risk
Drill-downs needed:
- By role/skill
- By project
- By individual
- Trend over time
6. Milestone Achievement Rate
What it measures: Percentage of milestones completed on time
Calculation: (On-time Milestones / Total Milestones) × 100
Why it matters: Simple, understandable metric for executives. Leading indicator of project health.
Target: >85% on-time completion
Analysis:
- By project phase
- By project type
- By project manager
- Trend analysis
Red flags:
- <75% achievement rate
- Declining trend
- Slipped governance gates
7. Budget Variance (Absolute & Percentage)
What it measures: Difference between planned and actual spending
Calculation:
- Absolute: Actual Cost - Planned Cost
- Percentage: (Variance / Planned Cost) × 100
Why it matters: Direct financial impact. Board and finance care most about this metric.
Target: Within ±10% of planned
Context needed:
- Variance reason (scope change, rate change, efficiency)
- Forecast to completion
- Trend direction
- Comparison to similar projects
Escalation:
-
15% variance: Immediate review
-
25% variance: Executive approval for continuation
8. Benefits Realization Tracking
What it measures: Expected vs actual benefits delivery
Components:
- Expected benefits (baseline)
- Current forecast
- Benefits realized to date
- Benefits at risk
Why it matters: Projects exist to deliver value. Without tracking benefits, you don't know if projects succeeded.
Target: 100% of planned benefits realized
Dimensions:
- Financial benefits ($$$)
- Operational benefits (efficiency, quality)
- Strategic benefits (capability, market position)
- Timing of realization
Common issues:
- Benefits not quantified upfront
- No ownership post-project
- Missing baseline data
- No measurement plan
9. Scope Change Frequency & Impact
What it measures: Number and impact of approved scope changes
Metrics:
- Number of change requests
- Approval rate
- Average impact on cost
- Average impact on schedule
- Cumulative impact
Why it matters: Excessive changes indicate unclear requirements or scope creep. Impacts schedule and budget.
Targets:
- <5 changes per project
- <10% cumulative schedule impact
- <10% cumulative cost impact
Analysis:
- By change category
- By stakeholder group
- By project phase
- Root cause analysis
10. Stakeholder Satisfaction Score
What it measures: Sponsor and key stakeholder satisfaction
Collection:
- Monthly pulse surveys
- Quarterly formal reviews
- Project closeout assessment
Dimensions:
- Communication effectiveness
- Deliverable quality
- Change management
- Issue resolution
- Overall satisfaction
Why it matters: Projects can hit all technical metrics but still fail if stakeholders are unhappy.
Target: >4.0 out of 5.0
Action triggers:
- <3.0: Immediate intervention
- Declining trend: Root cause analysis
- Variance by stakeholder group: Tailored approach
Building Your Dashboard
Design Principles
1. Hierarchy:
- Level 1: Portfolio overview (1 screen)
- Level 2: Category/program summaries
- Level 3: Individual project details
- Level 4: Deep-dive analysis
2. Visual Design:
- Use red/yellow/green consistently
- Charts over tables
- Trends over point-in-time
- Context over raw numbers
3. Interactivity:
- Click-through for details
- Filter by dimension
- Time period selection
- Export capabilities
4. Update Frequency:
- Real-time where possible
- Daily for operational metrics
- Weekly for project status
- Monthly for strategic metrics
Common Mistakes
❌ Too many metrics (dashboard overload) ❌ Metrics without targets or context ❌ Manual data entry (staleness, errors) ❌ No drill-down capability ❌ Same dashboard for all audiences ❌ No action triggers defined ❌ Pretty but not actionable
Best Practices
✅ Start with 5-7 core metrics ✅ Add context (trend, target, benchmark) ✅ Automate data collection ✅ Enable drill-down analysis ✅ Tailor views by role ✅ Define clear escalation triggers ✅ Focus on actionability
Implementation Roadmap
Week 1-2: Define
- Select metrics based on organizational priorities
- Identify data sources
- Define calculation methods
- Set targets and thresholds
Week 3-4: Build
- Connect data sources
- Create visualizations
- Test accuracy
- Gather feedback
Week 5-6: Deploy
- Train stakeholders
- Establish review cadence
- Document processes
- Iterate based on usage
Ongoing: Optimize
- Monitor adoption
- Refine metrics
- Add capabilities
- Improve automation
Conclusion
Executive dashboards should enable faster, better decisions. By tracking these 10 metrics, PMOs provide the visibility executives need without overwhelming them with detail.
The key is:
- Choose metrics that matter to your organization
- Automate data collection
- Provide context and trends
- Define clear action triggers
- Keep it simple and focused
With the right metrics and tools, your PMO becomes a strategic asset rather than a reporting burden.
Ready to build your executive dashboard? Start your free trial and get real-time portfolio visibility.
MyVirtualPCO
Turn project insights into concrete action
My Virtual PCO adds an intelligence layer on top of your project tools to track health, risks, budgets, and key decisions.
- Free plan available with no time limit for 1 project
- Project health score, risk alerts, and dashboards
- Essential plan from $49/month when you need more
Comments (0)
Leave a Comment
No comments yet. Be the first to comment!